Custom Charts & Dashboards - Product Update | August 2024

July was all about configurability and scale at Context.ai
We’ve always allowed the creation of custom graphs in our workspace, but these are now dramatically more powerful with many more dimensions available to filter and to group by, as well as a new UI.
Custom dashboards can now be created to save a group of custom graphs, for you to refer back to at any time
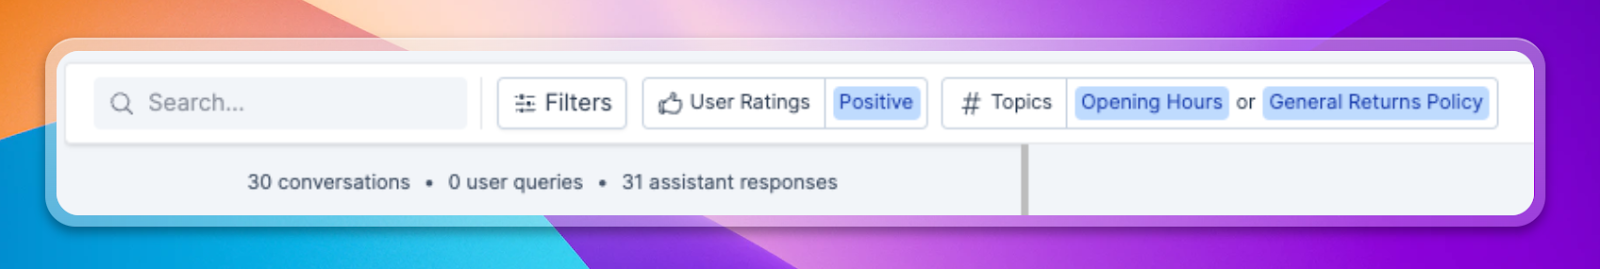
We’ve additionally launched a new experience for transcript filtering, and re-architected our backend to support significantly larger scale
Custom Charts
Our workspace is now much more powerful, with grouping by role, language, metadata and topic; filtering on language, role, sentiment, user rating; saving charts; and a new UI!

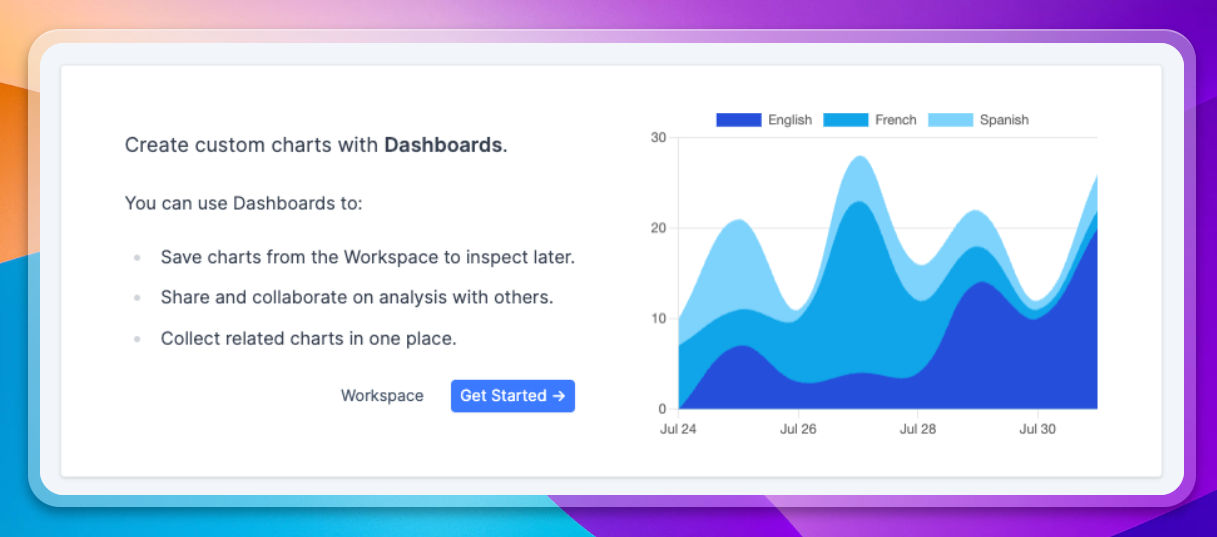
Custom Dashboards
Our custom charts can now be saved to custom dashboards! This has been a top request for a long time. To save a chart, first create a dashboard in the left navigation, and then create a custom graph in the workspace. Selecting the new save button in the workspace will allow you to add a title and save the graph to any of your custom dashboards.
Dashboards can contain many graphs, and these can be resized and ordered.

Transcript Filtering
Our new transcript filtering experience now allows you to more easily apply large numbers of filters, adding and removing each filter individually.